Bloomberg 1.0

Bloomberg

Bloomberg Terminal Explorer

Infographic explaining the Bloomberg Terminal

Project Overview

In the world of finance, the Bloomberg Terminal is an information behemoth.

It revolutionized the industry by giving traders access to troves of live market data, analyzed through thousands of specialized lenses. The Terminal is colossal, complex, and—to people outside of the finance world—virtually incomprehensible. Our task was to show regular people how it works.

 To make the data approachable, we worked with the Bloomberg Marketing Studio to tease out narratives from Terminal data. We turned each of these stories into a short motion graphics piece explaining one of the Terminal’s 12,000 functions. The animations borrow the iconic visual language of the terminal: amber, red, and green on black—and lots of charts.

The interactive lives in the heart of Bloomberg’s ambitious new London headquarters—an opportunity for guests and employees alike to grasp the incredible utility of this industry-defining tool.

Project Videos and Images

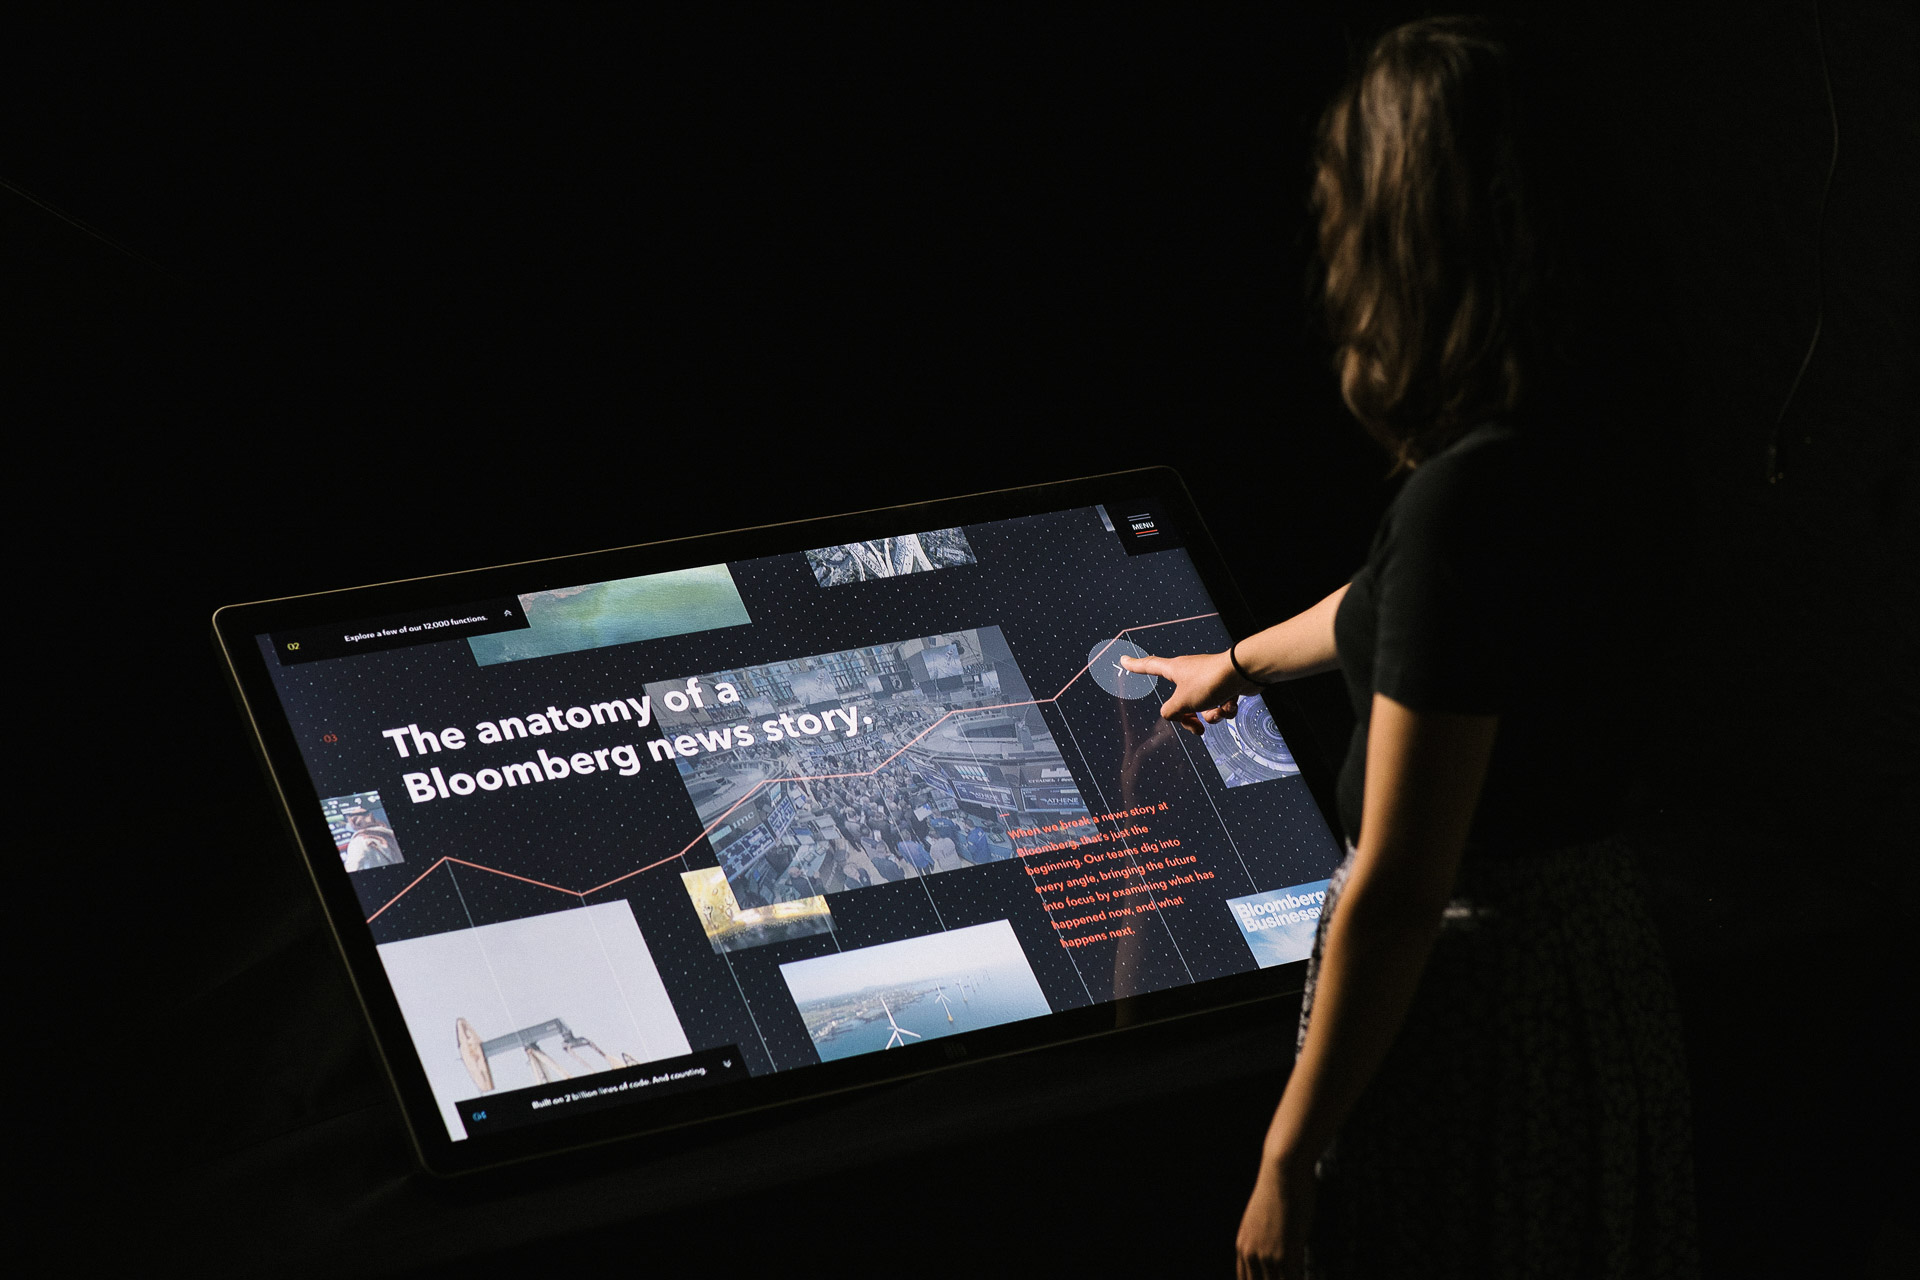
A visitor uses a interactive display to learn about how the Bloomberg terminal works and its importance in a global context.
  • A animated rendering with video of the forcible removal of a passenger off of an a American flight.

  • A graph displays important trends captured by Bloomberg's advanced terminal technology.

A interactive display shows major headlines from news sources.

  • A animation shows the international distribution of Bloomberg's data.

  • A visitor uses a interactive display to learn about the consumer market and its impact on the financial world,

A video displaying social media's impact on the financial market.